
The summer solstice is almost upon us, with – for those of us in the northern hemisphere – the longest days of the year. Here in the Pacific Northwest, that means it doesn’t get dark until after 10pm. Which is great, once the school year ends. Right now we’re all still trying to tell ourselves that it’s okay to go to bed when it’s still bright and sunny outside so we’re not exhausted for school and work the next day.
I’ve been thinking a lot about stories lately. Stories we tell ourselves. Stories we tell others. Stories that are a reaction to something. And stories that set the scene.
We’re in such an interesting time in clean energy. Some days interesting is good. For example, this monthly energy data report from Ember that shows wind and solar generating more electricity than gas in April.
Other days, interesting is not so good, like reading about the SEC moving to scrap climate disclosures for publicly-traded companies. Apparently if we don’t talk about it, it doesn’t exist. Whew! Glad we fixed it. (Yes, that IS sarcasm).
With all of the information, and misinformation, out there, how do we as an industry own and tell our story? How do we cut through the noise to tell an engaging, authentic, true story? A story that is ours and not a reaction to the story others are telling?
I don’t know the answer to those questions, but I’ve sure been thinking about it a lot. A takeback of the narrative that seems to have gotten away from us.
If you have ideas, please share them!

How clean energy companies can turn their vision into action
For anyone who has spent any time in the corporate world, you’ve likely experienced a company with a vision statement that gets trotted out during an annual meeting and maybe appears on the website. But day to day, the vision statement has zero impact. It’s a box that’s been checked instead of a living, breathing action statement.
Vision statements that live in drawers are about as useful as the dust that collects on them. A vision should be known by the staff, used in daily decision-making, and act as a guide.
Read on for three concrete actions your organization can take to incorporate your vision statement into everyday actions to keep your organization headed towards your vision.
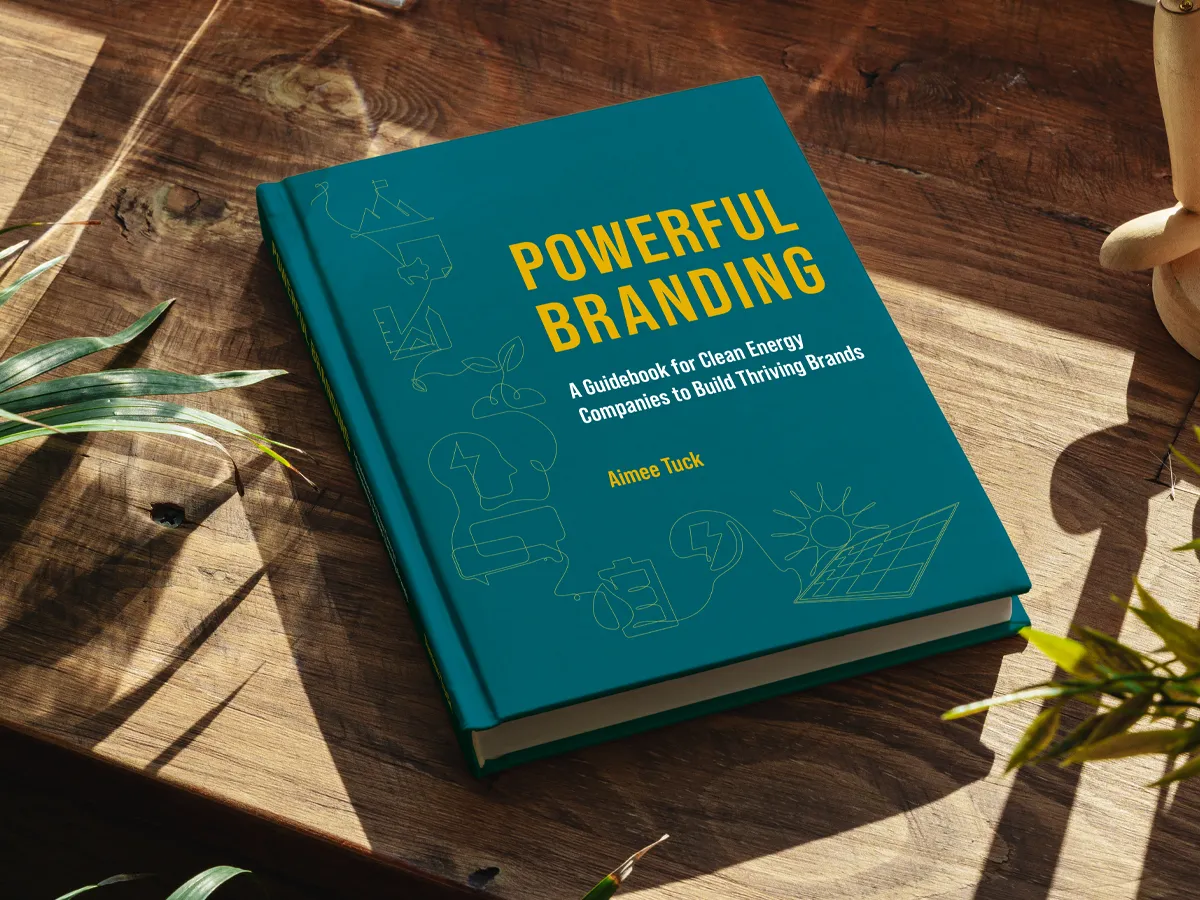
Thank you to everyone who shared, liked, and commented on posts as I launched my new book last month. I so, so appreciate the support!
And if you missed the announcement: hey, I wrote a book! Called Powerful Branding, A Guidebook for Clean Energy Companies to Build Thriving Brands, it’s available as an eBook PDF and in hardback.
Monthly makeover
This month’s makeover comes from an excellent report from Greenpeace on evaluating the energy transition. It’s well worth the read and can be found here: https://www.greenpeace.org/static/planet4-international-stateless/2026/06/b7edbfdf-energy-revolution10.pdf


Tables can be a good way to represent a lot of data in a compact form factor. However, when showing just a few pieces of data with a particular takeaway, they may not be the best way to show the data.
In the example, the intent is to quickly show how accurate the E(R) projection was when compared to other well-known projections. With just three pieces of data represented, a bar chart visually represents the same data in a quick-to-understand way. We can visually see the differences in projected versus actual generation. It gives us the opportunity to very quickly take in the overall message supporting the text of the report – the accuracy of the projections – while then inviting us to further understand the numbers. Overview first, then diving deeper.
The chart also uses color to differentiate between projected versus actual numbers, and labels the chart itself so we aren’t jumping back and forth between keys or other listed numbers. It’s all there in one chart.
An added bonus of the chart over the table in this scenario is that the chart lends itself to social posts and shares. It’s easier to read and parse for those who are scrolling through their social feeds.
If you have a slide, chart, or graph you’d like to see made over, send it my way. I’d love to feature it!
Of note

I find the conversation(s) around data center buildout fascinating. On the one hand, data centers have existed for years with capacity buildout happening pretty consistently. On the other hand, planned development to handle A.I. processing feels crazy ludicrous.
I sometimes think those of us in clean energy in the U.S. see A.I. data center buildout as a salvation for an industry that has been bombarded on several fronts. AND with all the pushback currently happening against data centers, what happens when solar, wind, and storage are associated with the anger communities feel at data centers?
I don’t know the answer to that, but I believe it’s worth thinking about.
In the meantime, Heatmap News has done some excellent reporting on data centers recently, including broad polls and deep dives.

Speaking of reputation management, I laughed out loud at the ridiculousness of this rumor floating around – that Frito-Lay wouldn’t buy potatoes farmed on solar farms. Canary Media’s coverage of this story is well-done. And, sadly, once again the solar industry is put in a position to react to the negative instead of building a positive story.
June joke

In honor of Father’s Day, a particularly eye-roll worthy dad joke:
My dad used to be addicted to the hokey pokey.
But then he turned himself around.